Telco Customer Churn
A Python investigation into the demographic, service, satisfaction, and promotion factors associated with telecom churn.
The question
Which customer and service characteristics are associated with churn, and how can those relationships become practical retention actions?
The approach
I explored 7,043 customer records with Python, cleaning and visualizing relationships among demographics, tenure, CLTV, charges, data use, satisfaction, offers, service types, churn status, and stated churn reasons.
The outcome
The analysis connects churn risk to satisfaction, tenure, fiber-optic service, specific promotions, and competitor offers—clear inputs for pricing, product, and retention strategy.
Analysis questions
What the work needed to answer.
- 01
How do age, data use, tenure, spend, and CLTV relate?
- 02
Which services and promotions have the highest churn rates?
- 03
How strongly do satisfaction and service quality connect to retention?
- 04
What reasons do customers give when they leave?
Method
From raw data to a useful answer.
Profile customers
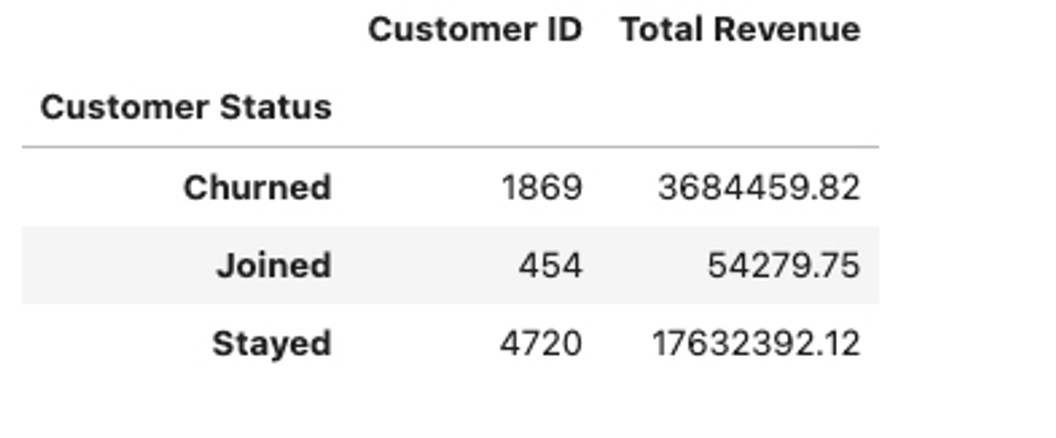
Compared age, demographics, average monthly data use, tenure, spend, revenue, and lifetime value.
Measure service risk
Calculated churn rates across internet types, streaming services, promotions, and customer tenure bands.
Test relationships
Used correlation analysis and visual exploration to separate weak associations from operationally useful signals.
Translate reasons
Ranked stated churn reasons to connect the quantitative patterns with customer decisions.
Results
What the analysis revealed.
Satisfaction matters
Satisfaction had a −0.50 relationship with churn, making service experience one of the clearest retention signals.
Competitors lead the reasons
Better competitor devices and better competitor offers were the most common stated reasons for leaving.
Fiber carries elevated risk
Fiber-optic customers showed the highest churn among internet-service types; several streaming services also exceeded 30%.
Tenure builds stability
Customers beyond one year were more likely to stay, while tenure correlated strongly with total revenue at 0.85.
Offer E needs review
Customers on Offer E churned at a higher rate than other promotional groups.
Young customers use more data
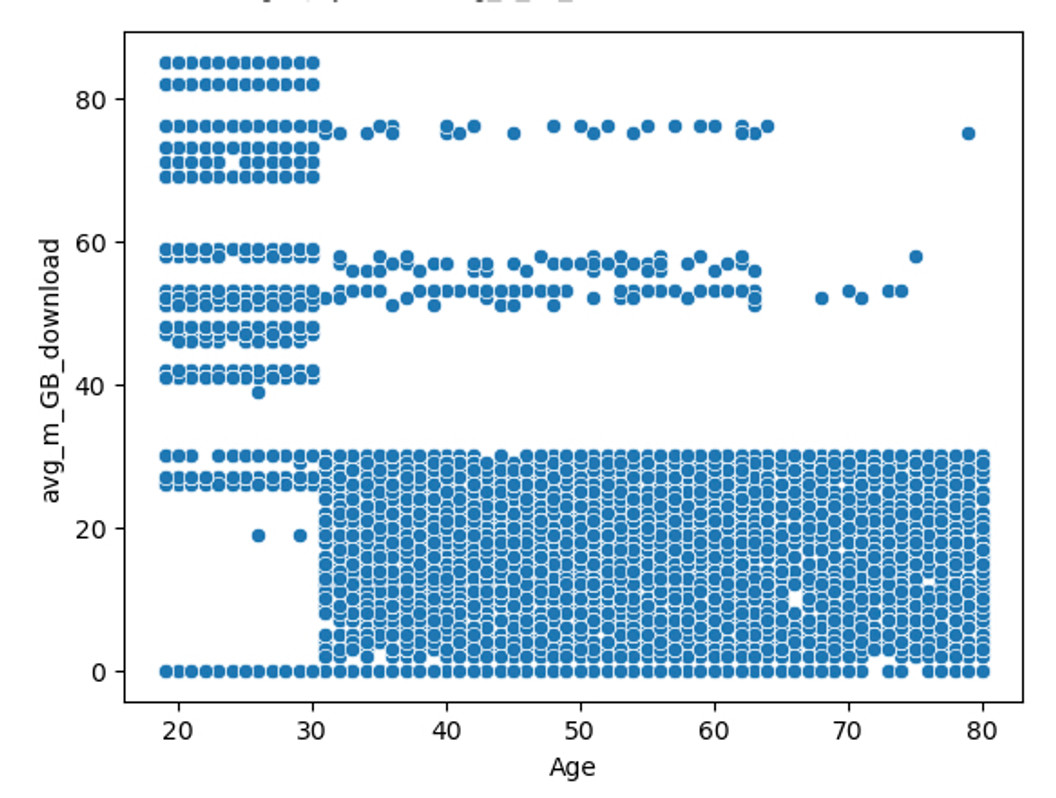
Customers aged 20–30 recorded higher average monthly gigabyte use, suggesting a distinct product opportunity.
Recommendations
How the findings can be used.
- 01
Review fiber pricing and service quality, then track churn after improvements.
- 02
Build tenure-based loyalty offers and competitive device programs.
- 03
Target younger, high-data customers with plans matched to their usage.
- 04
Reevaluate Offer E through controlled A/B testing before expanding it.