Studying Platform Analysis
A SQL investigation of how free and paid students engage, learn, subscribe, take exams, and earn certificates on the 365 learning platform.
The question
How do learners move through an online education platform, where do free and paid students behave differently, and which signals are most useful for improving conversion and retention?
The approach
I used joins, subqueries, and common table expressions to connect registrations, subscriptions, courses, watch time, exams, and certificates. The result is a set of analysis-ready views designed around the learner journey rather than isolated tables.
The outcome
The work establishes a reusable measurement framework for engagement, onboarding, course quality, free-to-paid conversion, subscription duration, exam success, and certificate completion.
Analysis questions
What the work needed to answer.
- 01
How many students engage, and how does engagement differ between free and paid learners?
- 02
Which courses create the most watch time, repeat study, and completion?
- 03
How do watch time and onboarding affect free-to-paid conversion?
- 04
Where do learners struggle in practice, course, and career-track exams?
Method
From raw data to a useful answer.
Build the learner view
Joined student, subscription, course, watch-time, exam, and certificate records into consistent learner-level measures.
Measure the funnel
Calculated registration, onboarding, engagement, paid conversion, subscription duration, and retention by cohort.
Evaluate learning
Compared total and average minutes, completion, ratings, exam attempts, pass rates, and certificates across courses and tracks.
Make it actionable
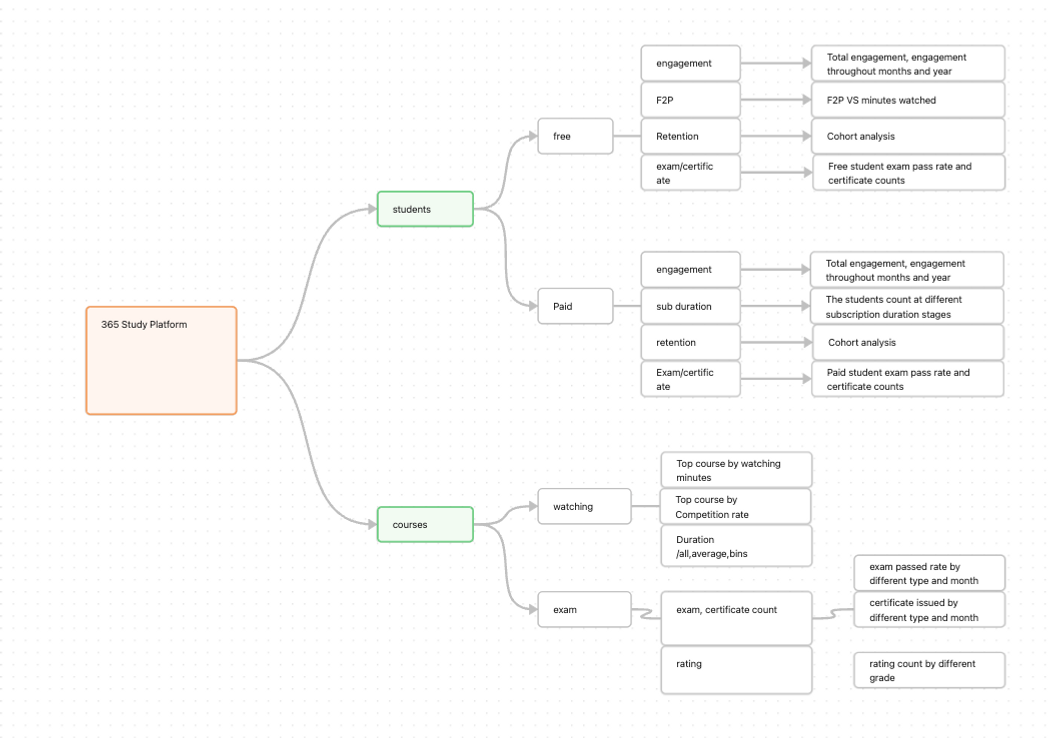
Organized the analysis into a Tableau overview so product, marketing, and learning teams can follow the same decision framework.
Results
What the analysis revealed.
Paid learners engage much more
Paid students watched an average of 543.7 minutes, compared with 21.6 minutes for free students.
Conversion has a clear window
Free-to-paid conversion was strongest around 110–120 minutes watched and declined after roughly 240 minutes.
Engagement is seasonal
Free-user activity surged in August, while registrations climbed sharply in October—useful timing for campaigns.
Exam outcomes vary
Practice and course exam pass rates exceeded 65%, while career-track exam performance ranged from 27% to 66%.
Recommendations
How the findings can be used.
- 01
Target learners approaching 110–120 minutes with a relevant paid offer.
- 02
Improve the first five minutes of onboarding so more registrants reach meaningful study activity.
- 03
Encourage longer subscriptions and provide extra preparation for career-track exams.
- 04
Coordinate campaigns with the August engagement and October registration peaks.