Brazil E-commerce Platform Analysis
A Tableau analysis of Olist marketplace performance across sales, customers, sellers, geography, products, payments, and reviews.
The question
Explain the marketplace's growth from 2017 to 2018 and identify practical opportunities across customer, product, seller, review, and payment behavior.
The approach
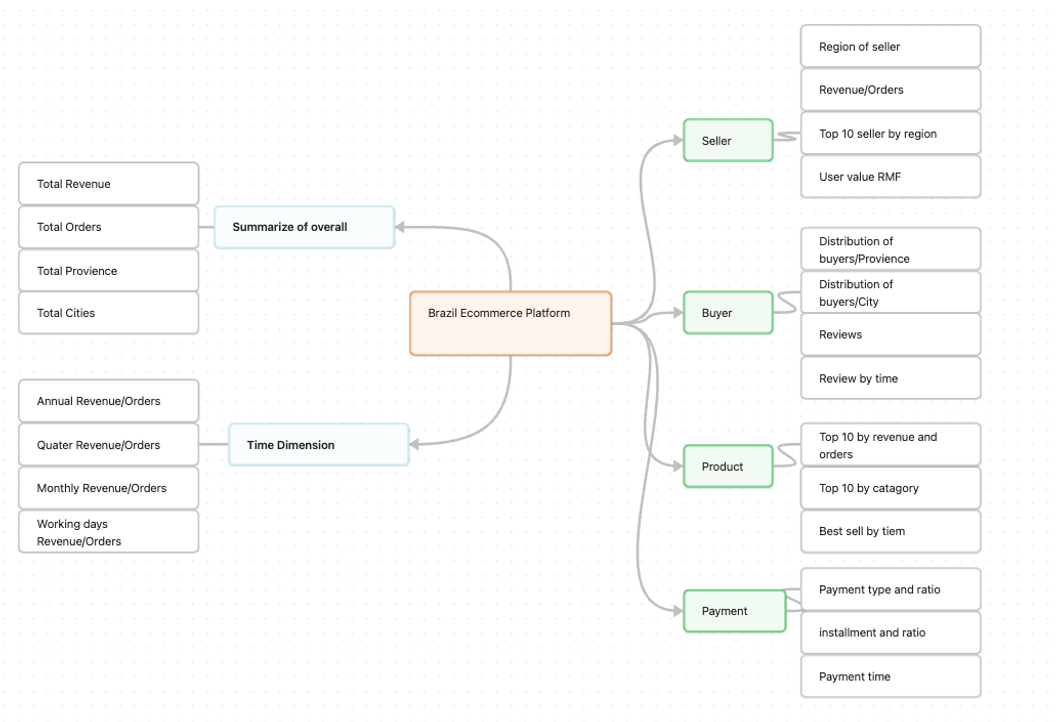
I built a KPI framework around revenue, buyers, orders, sellers, cities, and average order value, then analyzed the business by time, region, category, product, review score, payment type, and installment behavior.
The outcome
The dashboard makes the growth story visible and turns it into commercial priorities: strengthen core regions, create repeatable promotions, improve low reviews, and support the payment methods customers already prefer.
Analysis questions
What the work needed to answer.
- 01
How quickly did revenue, orders, buyers, and sellers grow?
- 02
Which dates, hours, states, cities, products, and categories drive activity?
- 03
How do customers rate the marketplace and how do they prefer to pay?
- 04
Where should marketing, seller development, and service recovery focus?
Method
From raw data to a useful answer.
Define the scorecard
Tracked revenue, price, distinct buyers, revenue per buyer, distinct orders, revenue per order, sellers, and seller cities.
Analyze time
Compared year-over-year growth and examined transaction patterns by date, weekday, and hour.
Map the marketplace
Separated customer and seller performance by state and city to reveal geographic concentration.
Read customer behavior
Connected products, categories, reviews, payment methods, installments, and transaction bands.
Results
What the analysis revealed.
Growth accelerated
Across the first ten months of 2018, revenue rose about 70% and orders about 73% versus 2017.
Promotions create visible peaks
The largest daily spike occurred on November 24, 2017, consistent with Black Friday demand.
The market is concentrated
São Paulo, Rio de Janeiro, and Minas Gerais generated more than 63% of revenue; São Paulo alone held about 42% of users.
Payments are predictable
Credit cards represented 75.8% of payments and boleto 19.88%; roughly half of buyers used one installment.
Reviews are strong but not complete
Five-star reviews accounted for 58.92% and four-star reviews 19.64%, leaving more than one in five ratings at three stars or below.
No single product dominates
Across 73 categories and 30,981 products, the top transaction product generated about $64,100 without becoming a dominant star product.
Recommendations
How the findings can be used.
- 01
Create smaller recurring promotions instead of relying on a single Black Friday spike.
- 02
Develop star products and bundles to make product discovery easier.
- 03
Follow up systematically on one- to three-star reviews.
- 04
Strengthen partnerships around credit card and boleto payments.