Customer Behavior
A Tableau dashboard translating 365 learning-platform data into decisions about engagement, retention, course performance, and paid conversion.

The question
Bring the platform analysis into one decision-ready view: who engages, what they learn, when they convert, how long they stay, and where learning outcomes can improve.
The approach
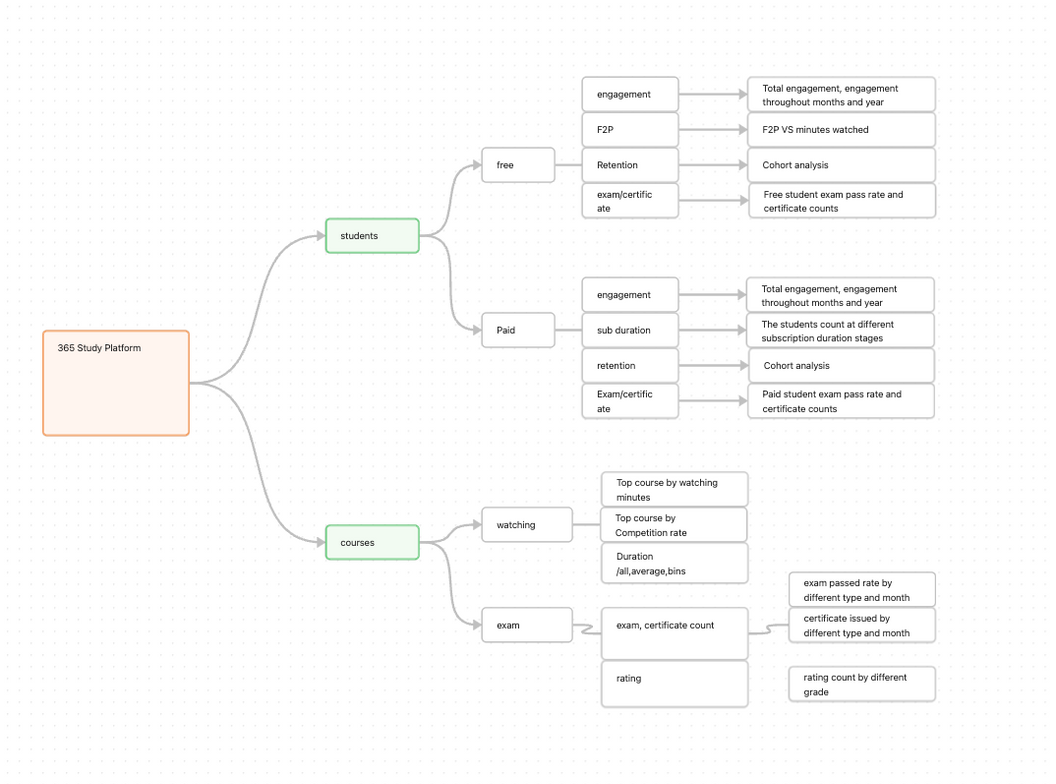
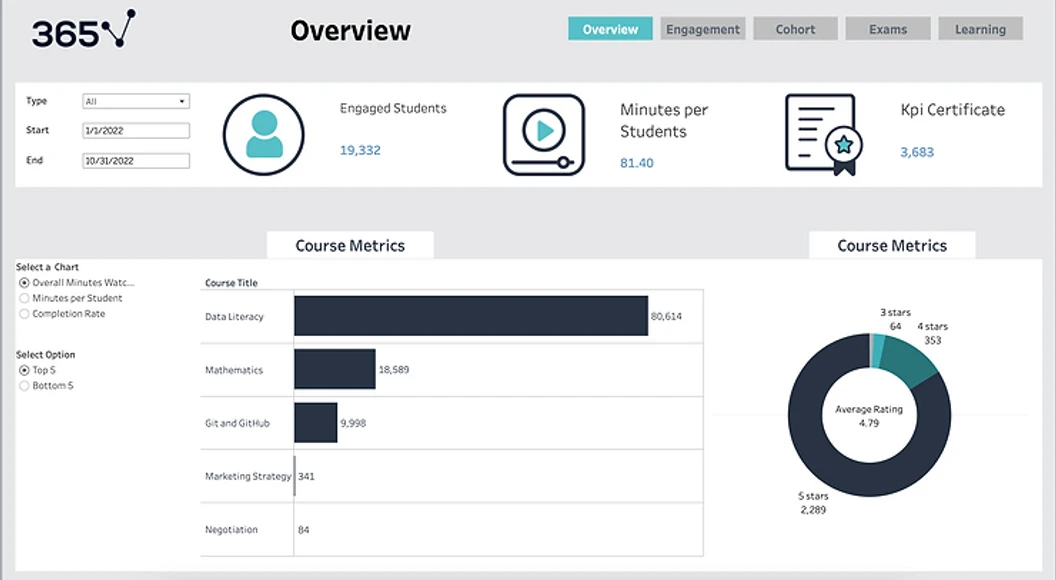
I organized students, courses, watch time, cohorts, subscriptions, exams, and certificates into an interactive overview. Filters and coordinated charts make it possible to move from headline KPIs to learner and course-level patterns.
The outcome
The dashboard surfaces a specific paid-conversion window, sharp free-versus-paid engagement differences, cohort decay, seasonal peaks, and career-exam opportunities.
Analysis questions
What the work needed to answer.
- 01
How large are the free and paid audiences, and how differently do they engage?
- 02
At what watch-time point are free learners most likely to subscribe?
- 03
How quickly does engagement decline after registration or purchase?
- 04
Which courses, exams, and certificate paths need attention?
Method
From raw data to a useful answer.
Create the overview
Combined headline KPIs for engaged students, minutes watched, course activity, and certificates.
Segment behavior
Compared free and paid learners by watch time, course performance, cohort, subscription duration, and engagement month.
Trace conversion
Grouped free learners by accumulated minutes watched to locate the strongest subscription window.
Connect learning outcomes
Compared practice, course, and career exams with certificate issuance and monthly trends.
Results
What the analysis revealed.
Paid and free behavior diverges
The analysis identified 18,032 free and 2,178 paid learners; paid users watched far more content on average.
Conversion peaks before fatigue
The strongest free-to-paid conversion appeared around 110–120 minutes watched, declining after approximately 240 minutes.
Retention falls quickly
Paid month-one activity was 51.8%, with more than 10% still active at month nine. Free engagement began near 3% and fell below 1% by month seven.
Course demand differs by metric
Data Literacy led total watch time, while Negotiation and Marketing Strategy were stronger on average minutes per student.
Career exams are the opportunity
Career-exam pass rates ranged from 27% to 66%, lower and less consistent than practice and course exams.
Long subscriptions engage best
Most paid users subscribed for 240–1,000 days, and the strongest engagement appeared within the 480–1,000 day range.
Recommendations
How the findings can be used.
- 01
Target learners around 110–120 minutes with personalized subscription prompts.
- 02
Improve early onboarding and reduce drop-off among learners with fewer than five minutes watched.
- 03
Promote longer subscriptions and reinforce the August and October acquisition windows.
- 04
Add career-exam study resources and mock tests to improve pass rates and certificate completion.